Trying to find math inside everything else

Archive for the ‘math’ Category

Counting Circles

Because I had different warm-up routines I wanted to try, I’m this week ending my second go at Counting Circles, and won’t be using them again until next year. But they’ve had a great run! I think the students got a lot out of them, and I experimented with them in lots of different ways, a few of which I captured as pictures, so I wanted to share them below.

I started, as with Sadie's recommendation, with just a simple off-decade 10s, to practice the idea.

I started, as with Sadie’s recommendation, with just a simple off-decade 10s, to practice the idea.

Inequality

One of the earlier things I tried was do work with an open inequality – that can count by any amount they want, as long as they don’t go below 40.

Binomials

Later on, we counted by monomials and, then, binomials. A fun thing that tricks them up is to swap the order of the binomial. (Commutative property!) Then see how starts adding the wrong thing together, just because they were going left to right.

Binomials with Subtraction

Counting up with one term and down with another can take a few moments for some students.

Later, after we had done exponential functions, I tried out a geometric sequence. But I had to make sure I started low enough that we could get around the class!

Later, after we had done exponential functions, I tried out a geometric sequence. But I had to make sure I started low enough that we could get around the class!

Another geometric sequence was the powers of 10. I mostly wanted to make sure they could name them all! They weren't allowed to just say digits for this one, they had to say the names.

Another geometric sequence was the powers of 10. I mostly wanted to make sure they could name them all! They weren’t allowed to just say digits for this one, they had to say the names.

Technically this one is still geometric, though it didn't feel the same. But I also was a stickler here, too - if a kid said "2 x 26" that's what I wrote, instead of "2x^26"

Technically this one is still geometric, though it didn’t feel the same. But I also was a stickler here, too – if a kid said “2 x 26” that’s what I wrote, instead of “2x^26”

As my last thing, today we did a quadratic counting circle. Now, we haven't done quadratic functions yet - that starts next week. So this was somewhat of a preview. They also weren't expecting the perfect squares - only one students noticed that in time to help them on their turn. There was a lot more collaboration on this circle because they had to refer back explicitly to what the last person did. I'll do two more of these (triangle numbers tomorrow), and then that's it!

As my last thing, today we did a quadratic counting circle. Now, we haven’t done quadratic functions yet – that starts next week. So this was somewhat of a preview. They also weren’t expecting the perfect squares – only one students noticed that in time to help them on their turn. There was a lot more collaboration on this circle because they had to refer back explicitly to what the last person did. I’ll do two more of these (triangle numbers tomorrow), and then that’s it!

The Lottery Choice

The other day I read Carl Oliver’s post about the safe and the piggy bank. I was reminded of a lesson I did last year in my exponential unit after taking Chris Luzniak’s wonderful course on debate in math and science classrooms. I wanted to make the typical doubling penny problem more debatable. It actually only really required a small change.


“Would you rather…

a) Win $100,000 a month for 30 months, or

b) Win a penny the first month and have your total doubled every subsequent month, for 30 months.”


This seems like the same problem as the typical formulation, on the surface, but it’s not. The key difference is in the length of time. Usually, the time frame is over a month with daily payments. This is because the number 30 lends itself well to the problem. In that case is pretty unreasonable to not just wait for the full month to get more money by using the penny.

But now though the penny option gets you more money in the long run, you have to wait a really long time before you get anything of value. It takes two years just to get the same amount of money as option A gets you in one month. For some students, that’s just too long to wait. When you need money, you might gladly choose option one for more immediate relief, even if option B gets you more in the end. So it’s a nice debate and would you rather question.

Elimination and Solving Equations

I bet you have all seen the following mistake:

mathmistakes.org

mathmistakes.org

There’s a problem here, but it’s certainly an understandable problem. It comes from, dare I say, a trick that we all teach. And it’s a trick we all think isn’t one – adding the same thing on both sides of the equation.

When I did my research project in grad school, I found that many students like the elimination method of solving a system of linear equations because of the way the elements lined up and made it very clear what to do – and this was true of students who used elimination well but could not solve a linear equation normally. It was then that I realized that elimination is actually the core of what we teach about solving equations – we just gloss over it.

It all comes down to two properties of equality: the reflexive property and the additive property.

Using elimination works because we have two different equations, but we add them together, like so:

3x + 2y = 20\\2x-2y=4\\ \line(1,0){75}\\5x\hspace{24 pt}=24

But the same thing is true when we normally solve a linear equation. It’s just that one of the equations is generated using the reflexive property.

-12 + 3x = 20\\+12 \hspace{24 pt}=+12\\ \line(1,0){75}\\\indent\indent3x=32

So actually a lot of things about solving equations become clear when I use elimination, which is why I try to introduce those ideas earlier. The goal here is that if we always have two equations that we are adding together (or subtracting, or dividing), then we can eliminate those mistakes where students add the same quantity twice on the same side.

(Basically, the additive property of equality is often formulated as a = b, therefore a + c = b + c. But I think it’s better formulated as a = b, and c = d, therefore a + c = b + d. And sometimes we use c=c instead of c=d.)

But it’d be great if they were introduced even earlier than when I do it – such as in middle school. Diving deep into the properties of equality, along with rate/ratio/proportion, are probably the two most important things for preparing for algebra.

\line(1,0){400}

While we’re talking about elimination, I want to bring up how it’s actually used. Today my kids were working on my Potato 3-Act problem. When solving that problem, you create the following system of equations:

2b+5r=\$2.83

2b+3r=\$1.97

So we solved by subtracting the two equations, giving r = $0.43 (the price of one red potato). Normally, at this point in the process, to solve for b we would use substitution, something like this:

2b + 3(\$0.43)=\$1.97

2b + \$1.29=\$1.97

And then you’d solve from there. But I realized that that’s not strictly necessary. Instead, we talked about what 3 red potatoes are worth, and wrote that as an equation, too. So now we had 2 equations, again, and we could use elimination.

2b+3r=\$1.97\\\indent3r=\$1.29\\\line(1,0){75}\\2b\hspace{24 pt}=\$0.68

No substitution necessary.


ETA: Additional examples of solving linear equations using elimination, at the request of Anna Hester:

CAM00486 CAM00485 CAM00484

Parallel to a Parabola?

A while back, I was working on a lesson about average rate of change and wondered the following question: “Could you use the word ‘parallel ‘to describe two non-linear functions that have the same rate of change/don’t intersect?”

Screen shot 2014-06-18 at 8.53.48 AM

Jonathan’s response, though, made me think about what it actually means to be parallel. Often when you ask students, they will respond “two lines that never intersect,” which I usually push back against because 1) how do you know they never ever intersect? and b) skew lines never intersect, either. So when I explain parallel lines, I use the fact that they have the same slope/go in the same direction as the actual definition, which has the consequence of never intersecting. So I looked it up on Wikipedia.

Given straight lines l and m, the following descriptions of line m equivalently define it as parallel to line l in Euclidean space:

  1. Every point on line m is located at exactly the same minimum distance from line l (equidistant lines).
  2. Line m is on the same plane as line l but does not intersect l (even assuming that lines extend to infinity in either direction).
  3. Lines m and l are both intersected by a third straight line (a transversal) in the same plane, and the corresponding angles of intersection with the transversal are congruent. (This is equivalent to Euclid‘s parallel postulate.)

I don’t think statement 3 was particularly useful to me, but the idea of being equidistant was interesting. A vertically shifted parabola is not equidistant from the original – though they never touch, the distance between them gets smaller and smaller.

So that raised the next question – how do I actually measure the distance between two parabolas at a given point? I asked my boyfriend and he responded, “Well, you definitely need calculus….” And who better to swoop in and help with that than Sam Shah.

Screen shot 2014-06-18 at 8.54.01 AM

So now that I know how to find the minimum distance between two functions, all I need to do is find a function that whose minimum distance to my original function is constant, and then I should have something that you could call parallel.

I made a little Desmos graphs with sliders, to help me visualize the process (click to access):

Screen shot 2014-06-21 at 1.27.13 PM

So I have the equation of the perpendicular line

y = \frac{-1}{f'(a)}(x-a)+f(a)

But that wasn’t really helping me see what the parallel function would actually look like. So then I turned to Geogebra. I needed to make a point on the perpendicular line that was a certain distance away from the function, say a distance of 1. So to figure out the coordinates of that point (x,y), I just used the distance formula, plugging in y from above.:

\sqrt{(x-a)^2+([\frac{-1}{f'(a)}(x-a)+f(a)] - f(a))^2} = 1

That gave me the coordinates of the point that is a distance of 1 away from f(x) at a:

(a + \frac{f'(a)}{\sqrt{1+(f'(a))^2}},\frac{-1}{\sqrt{1+(f'(a))^2}}+f(a))

So I made that point in Geogebra and activated the trace, which gave me this:

Screen shot 2014-06-21 at 2.20.38 PM

Lastly, I thought, well, what exactly is this function that I’ve traced? It looks kinda quartic, but that can’t be, because any quartic like this would intersect the parabola, right? So I tried to write the function for it, using parametric equations. Using f(t) = t^2, I made the parametric equation (t + \frac{2t}{\sqrt{1+4t^2}},\frac{-1}{\sqrt{1+4t^2}}+t^2).

I tried to plug that into Wolfram-Alpha to get the closed form, but it was a mess, so I still don’t really know what the closed form would look like. But who says a parametric form isn’t a solution?

(Here is a Desmos page with a summary of what I’ve done, and some sliders to play with, similar to the Geogebratube page, but with colors.)

The Factor Draft

Last year at #TMC13, I ran a session called Making Math Games. I stared off with an overview of what makes a game a good game, while still being good math pedagogy as well. Then we spent most of the session in two groups brainstorming idea for games for topics that are somewhat of a drag to get through. The other group worked on something in Algebra 2, though I don’t recall what – I must say both groups were supposed to write up what we did and neither did. (But I do think Sean Sweeney was in the other group, so maybe he remembers.)

My group worked on a game for factoring, focusing on Algebra 1. I took the ideas from the session and made a mostly operational game. Then, about 2 months ago, Max Ray came to visit me on the day I was unveiling that game in class. He saw it and it worked out…okay, but here was definitely improvements to be made. So we talked over lunch (about many things, not just the game – he’s great to talk to!) and then tried out some changes with my lunch gang. The changes seemed to work and I went forward with the new version in my afternoon classes to great success. By the end I think I had a really wonderful game, and so I wanted to share it with you.

The Materials

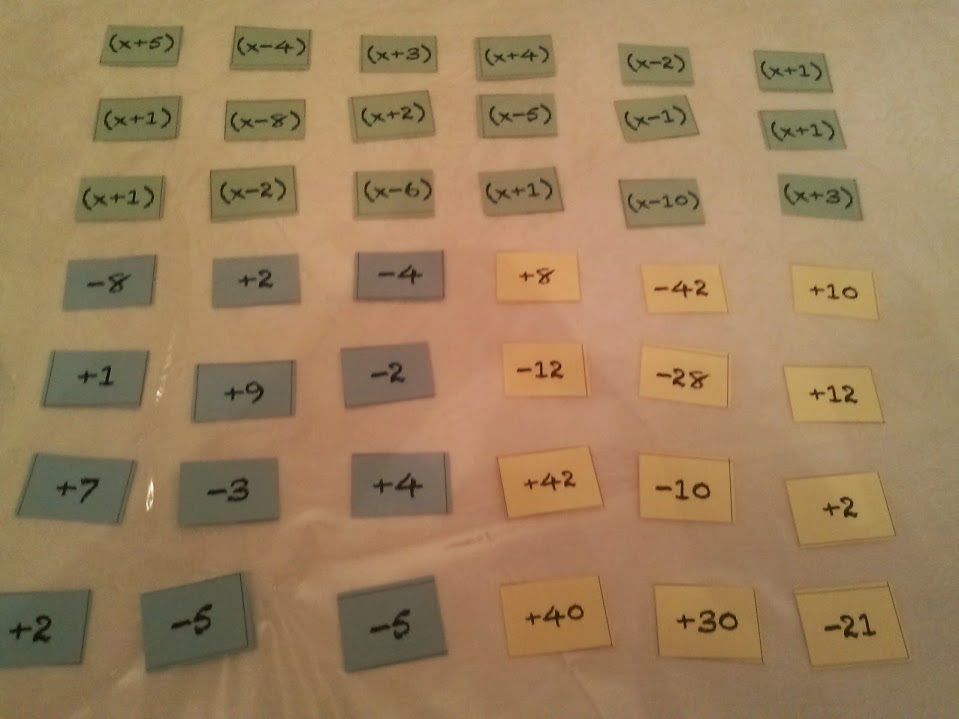
A set of Factor Draft cards includes 3 differently-colored decks. Mine, pictured here, were green, blue, and yellow. One deck (green here) is the factor cards, with things like (x + 2) and (x – 1) written on them. Another deck (blue) is the sum cards, with numbers like 10x or -4x. The last deck (yellow) is the product cards, with numbers like +36 or -15.

The Set-up

Lay out the cards as follows: make a 3 x 6 rectangle of factor cards, a 4×3 rectangle of sum cards, and a 4×3 rectangle of product cards, all face up. Place the remaining cards in separate piles next to the playing area.

Board Set-up

In the cards I printed, I didn’t put the Xs on the blue sum cards. Max suggested I do because it’s easy to be confused on which is which.


The Objective

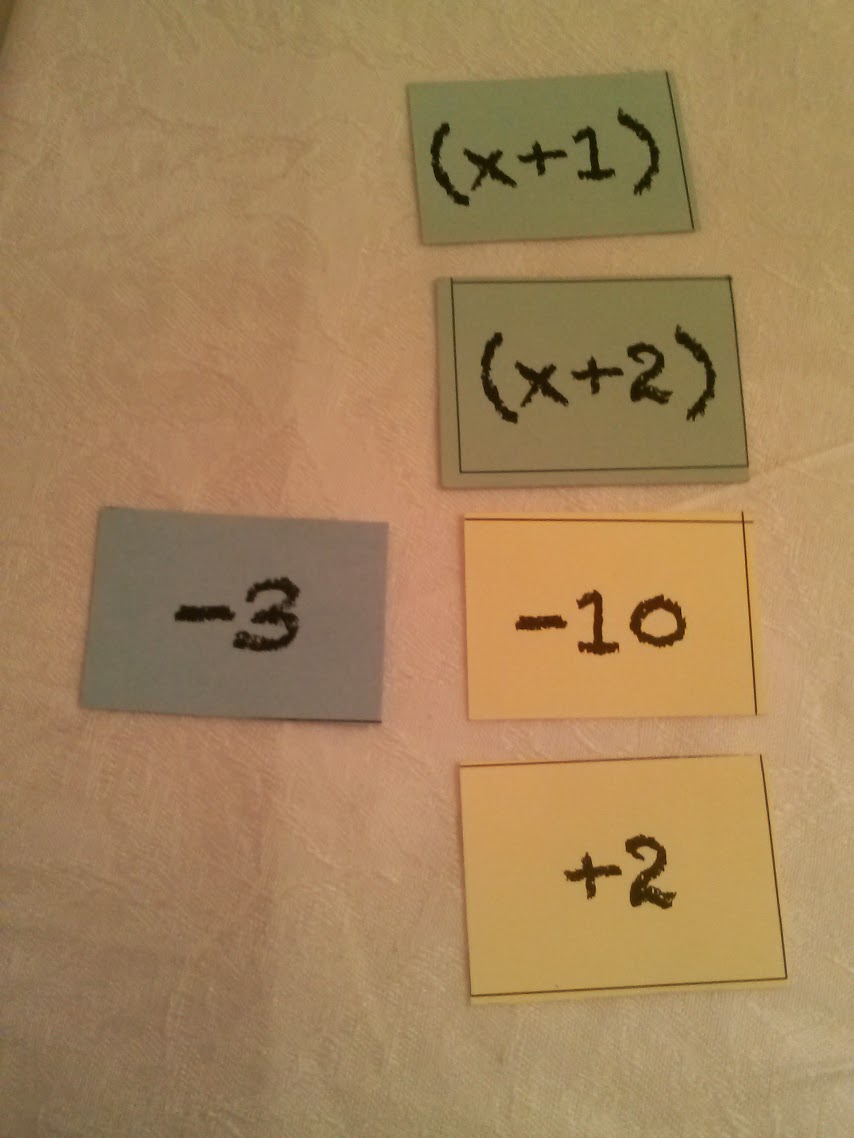
The goal of the game is to collect 4 cards that can be used to complete a true statement of the following form: (factor card)(factor card) = x^2 + (sum card) + (product card).

Gameplay

Each turn, a player may select any card from the playing field and place it face-up in front of them. They then replace that card with a new card of the same color from the deck. Play passes to the left. A player may have any number of cards in front of them, and may use any four cards to build a winning hand.

The cards I collected after turn 6. There's two possible cards I could pull to win the game - can you see which ones?

The cards I collected after turn 5. There’s two possible cards I could pull to win the game – can you see which ones?

If at any point a player achieves victory, if they had more turns than the other players, they must allow the other players additional turns to attempt to tie. Upon a tie, discard the winning cards and continue play as a tie-breaker.

A winning hand.

A winning hand.


My co-teacher, when we were testing the game, said that it felt like Connect 4, in that with each move you have to decide whether to go on the offense to try and complete your four cards, or go on the defense and block the other players’ sets. But as each player gets more and more cards in front of them, it’s hard to see all of the connections and effectively block, so the game will always eventually lead to victory.

I may need to adjust the number of cards and type of cards in the decks, but I think what I currently have works well – if you have any feedback on the card distribution, let me know. The sum cards go from -10 to +10, with the numbers closer to 0 more common. The product cards go from -60 to +60, with each product card being unique. And the factor cards go from (x-10) to (x+10), also with the ones closer to 0 being more common. (There are no (x+0) cards.)

I did a whole little analysis to determine how many of each type of card to include…but maybe that’s a post for another day.

Downloads

Sum:Product Deck – The first four pages are the sum deck, the next four are the product deck, the last four are the factor deck.

Factor Draft Play Mat and Rules – Players can use these mats to place their cards and check for a win.

Counting Circles in Algebra II

So there’s a good chance I’ll be teaching Algebra II next year (will everyone leading a morning session in TMC14 change courses before it arrives?) and so I was thinking about my future routines. My students will be (mostly) students that I taught last year, plus the current freshmen who are advanced in Geometry. Last year and this year I was big on Estimation180 but, because I was so big on it, they’ve seen a lot of it. There’s still plenty they haven’t seen, but I wanted to expand. I remember reading someone who said they used Estimation180 one day, Visual Patterns another, Counting Circles another, and I think there was a fourth but I don’t remember what. I thought it sounded like a good idea.

I was hesitant about counting circles at first because, yeah, my students do need to boost their mathematical fluency, number sense, and mental math, and that is always helpful, but it’s a lot of time to spend on stuff that is technically not part of the curriculum. But then I started to think about all the things we could count that would specifically enhance the Algebra II curriculum, and I got excited.

Things We Can Count

  • Monomials (2x, 4x, 6x, 8x…)
  • Polynomials (a + 2x, 2a + 4x, 3a + 6x…)
  • Fractions of \pi (\frac{\pi}{6}, \frac{\pi}{3}, \frac{\pi}{2}, \frac{2\pi}{3}, \frac{5\pi}{6}, etc)
  • Sin/Cos/Tan values of those values above
  • Imaginary numbers
  • Complex numbers
  • Geometric Sequences (1, 2, 4, 8….)
  • Geometric Sequences with Negative Ratios (1, -2, 4, -8….)
  • Monomials geometrically (x, x^2, x^3, x^4…)
  • Irrational numbers (\sqrt{2}, 2\sqrt{2}, 3\sqrt{2}…)

What else could we count?

The Alien Bazaar

Michael blogged and tweeted about exponentiation being numbers instead of operations, which made me think of a lesson I attempted last year. It didn’t go quite as planned, but I liked the idea, so I said I’d write about it.

At a Math for America meeting, we were working on problems with different bases. I was talking with the facilitator about how glad I was that my 4th grade teacher taught us alternate bases, as I’m sure it was pivotal in greatly improving my number sense. Later on in the session, we were talking about “real world math,” and I brought up how it’s not the real world that is important, but that the setting of the problem is authentic and internally consistent. The presenter remembered a lesson she had seen that was totally fictional, but still felt authentic: if aliens with different numbers of fingers (and thus, presumably, differently-based number systems) were at a galactic bazaar, how would they sell things to one another?

I loved the idea, and so wanted to extended it beyond the simple worksheet-based problems that it was. I wanted to have an alien bazaar right in my classroom. So I developed 6 species of aliens, each with a different number of fingers. Each species of alien brought a different set of items to the bazaar, to sell to the others. Each species also had a shopping list of items it needed to purchase before it could head back home. (I set up groups of four to be all the different races.)

Each species’s inventory was given to them in a folder containing all the items. (Each species had a monopoly on one specific item, but was in competition with the other items, and no one race had enough to satisfy all customers.) The first task was, given the prices of each item in decimal, to convert them to the number system of the group’s race and set up a shop with a display and the items spread out.

After that was complete, each group was given blank-check currency, color-coded by race. Two members of each race were to act as shoppers, going around to the other races and 1) figuring out how much their item cost, 2) figuring how much money that would be in their own number system, and 3) making sure the shopkeeper agreed with their payment.

The other two students stay behind to run the shops, checking the work of each shopper to make sure they were not ripped off. This made is more like a bazaar – both the buyer and the seller had to agree on the price being paid, which can be tough when the buyer and the seller use different number systems!

I was really excited by this idea, but it didn’t pan out quite the way I wanted. I think the main problem was that there wasn’t enough time – these are big, unfamiliar ideas and the whole process needed more time than I was willing to give it. I taught the lesson in the hopes of strengthening their ideas about exponents and scientific notation, but since those are such a small part of the 9th grade Integrated Algebra curriculum, I couldn’t really devote a lot of time to it. I hear they are big parts of the 8th grade common core standards, so this might work well in an 9th grade classroom or even earlier.

What I did do, though, to salvage the situation, is to segue the lesson into an exploration of polynomials, and this is related even more so to what Michael talked about with exponents being numbers.  When we have the number 132, that number is really 1 \cdot 10^2 + 3 \cdot 10^1 + 2 \cdot 10^0. But that’s only for us humans. If that number were written by the 5-fingered aliens, it would be 1 \cdot 5^2 + 3 \cdot 5^1 + 2 \cdot 5^0. And, in general, if we wanted to figure out what that number means for any number-fingered alien, we would use 1 \cdot x^2 + 3 \cdot x^1 + 2 \cdot x^0. So we looked at that in Desmos.

Screen shot 2014-05-10 at 4.17.01 PM

We start with x=4 because 132 doesn’t make sense as a number for a base smaller than 4. And now we can see all the different values of 132 in the different bases. As we go into numbers with more digits, we start to get more interesting polynomials, which was also fun to explore.

I’d love to hear feedback.

Hedging Your Bets

At trivia tonight, one of the bonus round was a matching question – match the 10 movies to the character Ben Stiller plays. We (and by we I mean my teammates, as I know very little about Ben Stiller) knew 7 of the questions for sure, but had no clue for the other three.

At that point, one of my teammates asked me if it would make more sense to put the same answer for all three, rather than guessing. That way we would be guaranteed a point, as opposed to maybe getting them all wrong. It took me a minute to think it through, but I told him it didn’t matter either way and I’d rather take the chance of getting all 3 right. (We won trivia on a tie-breaker final question, so a 1 point difference would have been a big deal.)

I figured there were 6 possible ways we could write down our answer – 1 correct way (call it A B C), 3 ways that get us 1 point (A C B, C B A, and B A C) and 2 ways that get us 0 points. (B C A and C A B). Calculating that expected value gets us an EV of 1 point, the same as his suggestion – so, mathematically, they are equivalent. Then it just comes down to your willingness to take that risk, since it’s not a repeatable event.

And as we always say every week, go big or go home.

Estimation180 and Absolute Value Graphs

So as I was getting ready to teach absolute value graphs a little while ago, I came across this post from Kate Nowak about a lesson she did with it. I liked the idea but…I didn’t like the idea of having to “get my butt into overdrive” to collect data from staff and students about such a thing. I wanted a lesson for the next day, so I didn’t really have time for that.Screen shot 2014-03-26 at 6.52.24 PM

But then I thought, well, my students have been doing Estimation180 all year long. Maybe there’s a way I can use that? I even tweeted Kate about it, but was left to my own devices. (Though I suppose this is finally the write up I promised.)


I thought about what was different between what we’ve done with Estimation180 and Kate’s task, and then it hit me – Kate’s lesson is all about one guessing event, but we have loads of different ones. At that point we have done ~30 estimations. What if we could do some comparisons?


My premise was this – Mr. Stadel, who runs the Estimation180 site, wants to implement a ranking system where all the estimations are listed as “easy” “medium” “hard” etc. But how can he tell when one is hard or not? He knows all the answers, so he can’t used himself to judge. So I told Mr. Stadel that we have lots of data from our class and we could probably use it to come up with a system.

[Aside – this was the 3rd or 4th day of the new semester, and to complete the task I asked students to use the estimation sheets from the previous semester. They revolted, because they claimed I had told them they could throw those out! Which I vowed I didn’t…though, to be honest, it’s possible I did, since I hadn’t thought of this lesson yet. Luckily enough students had not thrown them out so that it could still work.]

So I reviewed what the estimations we did were and I told each group that they have to pick one estimation that they wanted to evaluate. Then they had to collect data from their classmates (and from the binders of other classes, through me) – the estimate each person made and what their error was. Once they have collected enough data, they have to make an Error vs Estimate graph and see what happens. Then I had them make some analysis on whether this counted as a difficult task or not. I didn’t have them compare graphs at the time, but I totally should have.

I think it worked pretty well and many of the students understood why it should be a V-shaped graph. They were at first surprised about where the vertex was, but then it made sense, especially comparing many different error graphs.

Estimation Difficulty Rating (Word format)


Set Building Game

(For Explore MTBoS Mission #1)

So I came up with this semi-game last year, based on Frank Noschese’s Subversive Lab Grouping activity. My students had already done that activity at the beginning of the year, so they were familiar with the cards and the idea that the groups were not always what they appeared.

This time, I gave each student a badge that had two words on it: one word on the front, and one word on the back. I asked the students to create groups of 3-4 students using either of their two words. After they formed a group, they had to come up with a description of their group that applied to ALL of their members but ONLY to their members.

This was tricky because of the set of words that I chose, which I had displayed at the front of the room. Set Game List.007

Almost any group of 4 you could create would have some errant fifth member that would fit. And I was VERY adamant that they could not have more than 4 people in a group, no matter how much they asked. So the students needed to use set operations to include or exclude other words. For example, if the students were {Arizona, Brooklyn, Georgia, Virginia} they might say “Our group is the set of x such that x is a girl’s name AND x is a location AND x is NOT Asian.”

Often students would give sentences that weren’t quite precise enough, so I (and later other students in the class) would push back. “Wait! China is a girl’s name and a location.” “Okay, so we’ll add ‘AND x is not Asian.” This caused them to think deeply about what the actual definitions of their group were, and to be careful with being precise. If they weren’t precise enough, they would let other words into their group.

After we got the gist, the groups would then either come up with a description and see if the other students could guess their members OR list their members and see if the other students could figure our their description.

Each round, I had the groups write down on an accompanying sheet their group in Roster Notation, Set Builder Notation, and draw a Venn Diagram where they shaded in where their group lies. So through this I introduce the different notation we use, intersections, and complements. (That left only unions and interval notation for the next day.) I also included pictures of 4-way and 5-way Venn diagrams, in case they needed it.

Stuff

Set Cards (pdf – formatted for name-tag size)

Set Game Worksheet (pdf)

Set Game Worksheet (pages)