Streak Bonus in the Pokémon TCG
Here’s a fun problem I worked on recently – fun enough that I nerdsniped two of my coworkers about it. Here’s the problem:
In the Pokémon TCG Pocket app, I would earn 10 points for winning a match and lose 7 points when losing a match. However, you also get a win streak bonus – the second win in a row gets a bonus of 3 points, the third gets 6, the fourth 9, and the fifth (and all subsequent) gets 12. Assuming I have a win rate of 50% (which I did at the time), what’s my expected value for playing n games? (How many games would I expect to play to earn x points?)
Below is a journey through my thought process – you can jump to the end if you just want the answer.
I started by writing out the different possibilities of runs of wins and losses for 1 game, 2 games, 3, etc. Thinking that if I listed them by hand I might miss some, I realized that I could use CONCATENATE in a spreadsheet to work recursively – take all the runs from (n-1) games and append a W at the end, then repeat the process with an L. So I did that here:
https://docs.google.com/spreadsheets/d/1izBy3wN-sVFV8SxExDxGC9rNVebEA5C7iPydU_kmP1Y/edit?gid=748567562#gid=748567562
(There’s 3 tiers, each with its own sheet – Master Ball Tier, where you lose 10 points on a loss, Ultra Ball with 7 [the tier I’m in], and Great Ball with 5. It makes sense to work through the problem in Master Ball, so you can just focus on the streak, and then adjust afterwards.)
Notably because I had some errors in my data, my calculated EVs and EV/game didn’t seem like nice numbers, so my first instinct was to turn to statistics. I did a log regression for the EV/game numbers and then used that to calculate when I would hit the number of points I needed (340). [You can just change which function it is to change tiers.]
https://www.desmos.com/calculator/tspirmvama
This felt unsatisfactory and I wondered if my logic was sound, so I roped in the inimitable Sam Shah and talked him through the problem. He voiced his belief that there would be an explicit solution, so that turned me back to my table. As I walked him through it, we found the errors I had, which made things look nicer, so on the right track.
What really matters as you go through each game in the run, once you get past 5 games, is just the final five games. As you go through each game, we’ll notice that there’s a doubling happening. For example, after 2 games there’s 1 way to end in 2 wins, 1 way to end in 1 win, and 2 ways to end in a loss. After 3 games, there’s 1 way to end in 3 wins, 1 way to end in 2 wins, 2 ways to end in 1 win, and 4 ways to end in a loss. Once you get past 5 games, you no longer need to be introducing new sequences to look for, so then they start combining, as below:
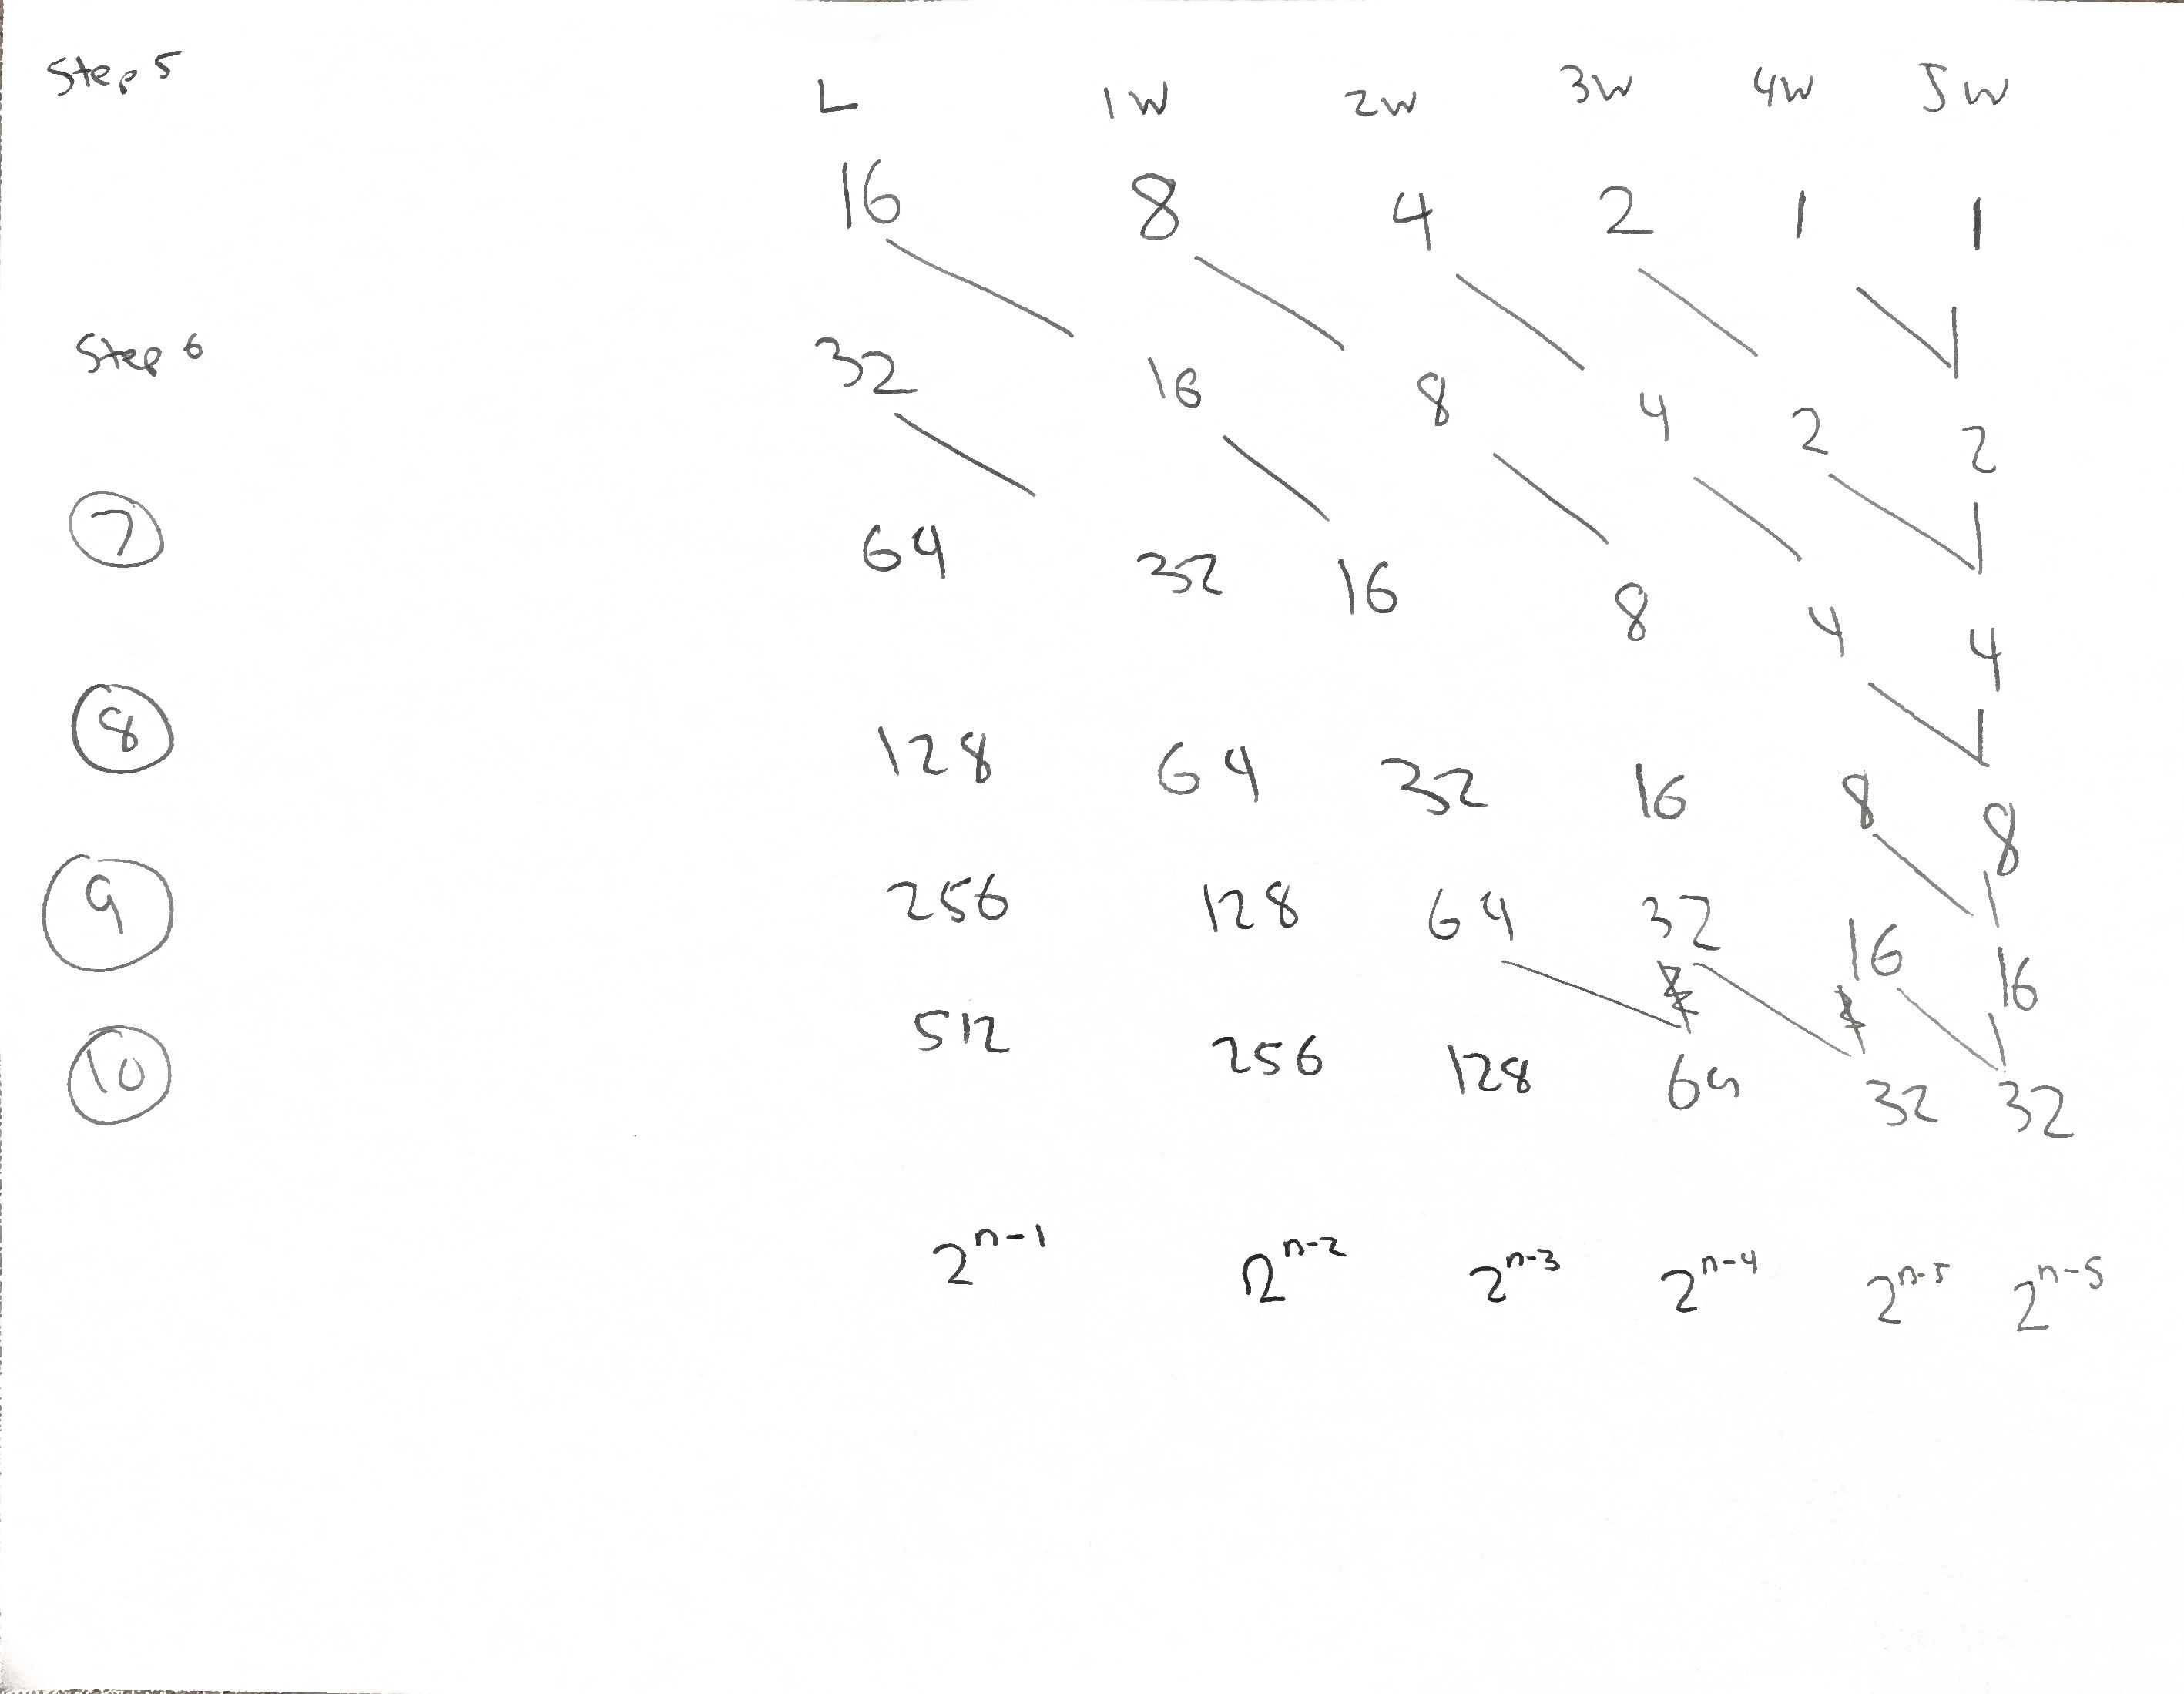
For every game that represents a run that ends in 5 wins, I need to add 22 points. For every game that represents a run that ends in 4 wins, I need to add 19 points. And so on. And the total number of possible runs is 2^n, so to get the expected value of a single game, I would need this expression (for Ultra Ball tier):
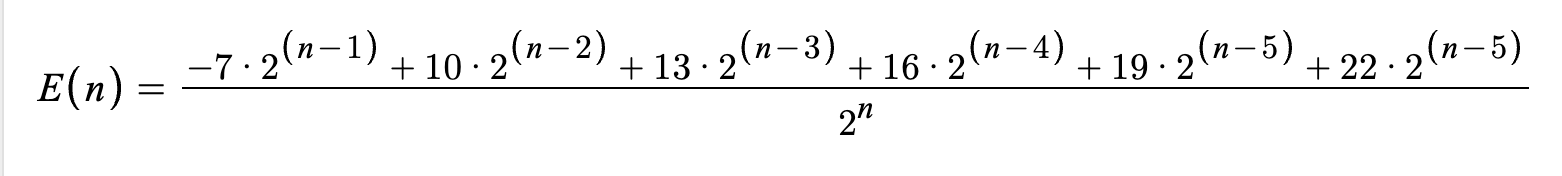
Then I just need to add that value for every game past 5 onto the value I already calculated for 5 games, and voila!
But wait, you may have noticed that that expression could be reduced. In fact, once you reduce it, it no longer depends on the variable n – it’s constant!
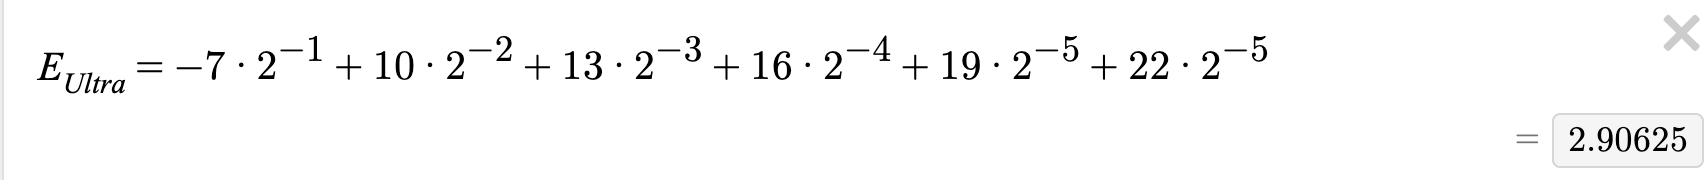
So basically we have linear function with this value as the slope (and a domain of more than 5 games). So I made this graph to represent the three tiers – just input for y how many points you’ll need and the x-value for each intersection will tell you how many games you expect to play for each tier.
https://www.desmos.com/calculator/jdrc6qzrsh
Extension questions: What if I didn’t have a 50% win rate? How low could my win rate go and still have a positive expected value? I leave those as an exercise to the reader.
 , but it was putting some games that just weren’t very good as top choices. The problem was that the volume was having too big of an effect – games could come in thousands of cubic centimeters of volume, but max at around 8 for rating and 12 for players. (I had to use amazon.ca to look up the dimensions because I wanted to use centimeters.)
 , or finding the geometric mean of the three numbers, but still nothing came out right.