I love this lab, but I’m sure it can be improved, so I’d love to hear feedback in the comments.
When I was student teaching at Banana Kelly, they had a combined math/science program that often had many lab activities, both math labs and science labs. But I noticed the Systems of Equations unit didn’t really have a lab, so I set out to make one. I created the Archimedes lab because of that.
The story of Archimedes and the Crown of Syracuse says that he was able to determine that the crown was not pure gold by using mass and volume. We start by watching a short video about the story. (I had assigned the video as homework, but no one watched it. While my video homework watching rates aren’t stellar, they’ve never been this bad. I blame the fact that it’s been a while: the last video was in December.)
Then I tell them that we can do Archimedes one better. It’s been over 2000 years since he lived and we have algebra and precise tools on our side: we can figure out exactly how much gold was stolen, not just if some was.
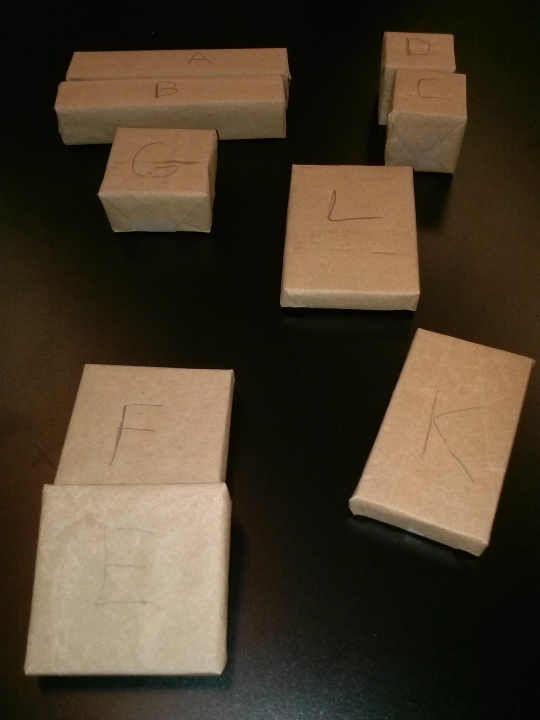
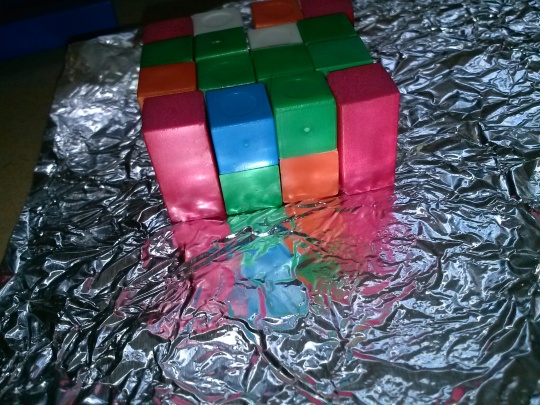
To demonstrate this, we built several Mystery Blocks out of two different materials. Back at BK, we had lots of different materials in the science closet to use. Because the students would know the type of material (brass, aluminum, wood, etc) but not the size and shape, they would have to use density to solve the problem. (But I had seeded the story throughout the whole unit.) The density kit I requested last year never arrived, though, so I had to scrounge around for something, and I found the perfect thing: Cuisinaire Rods.
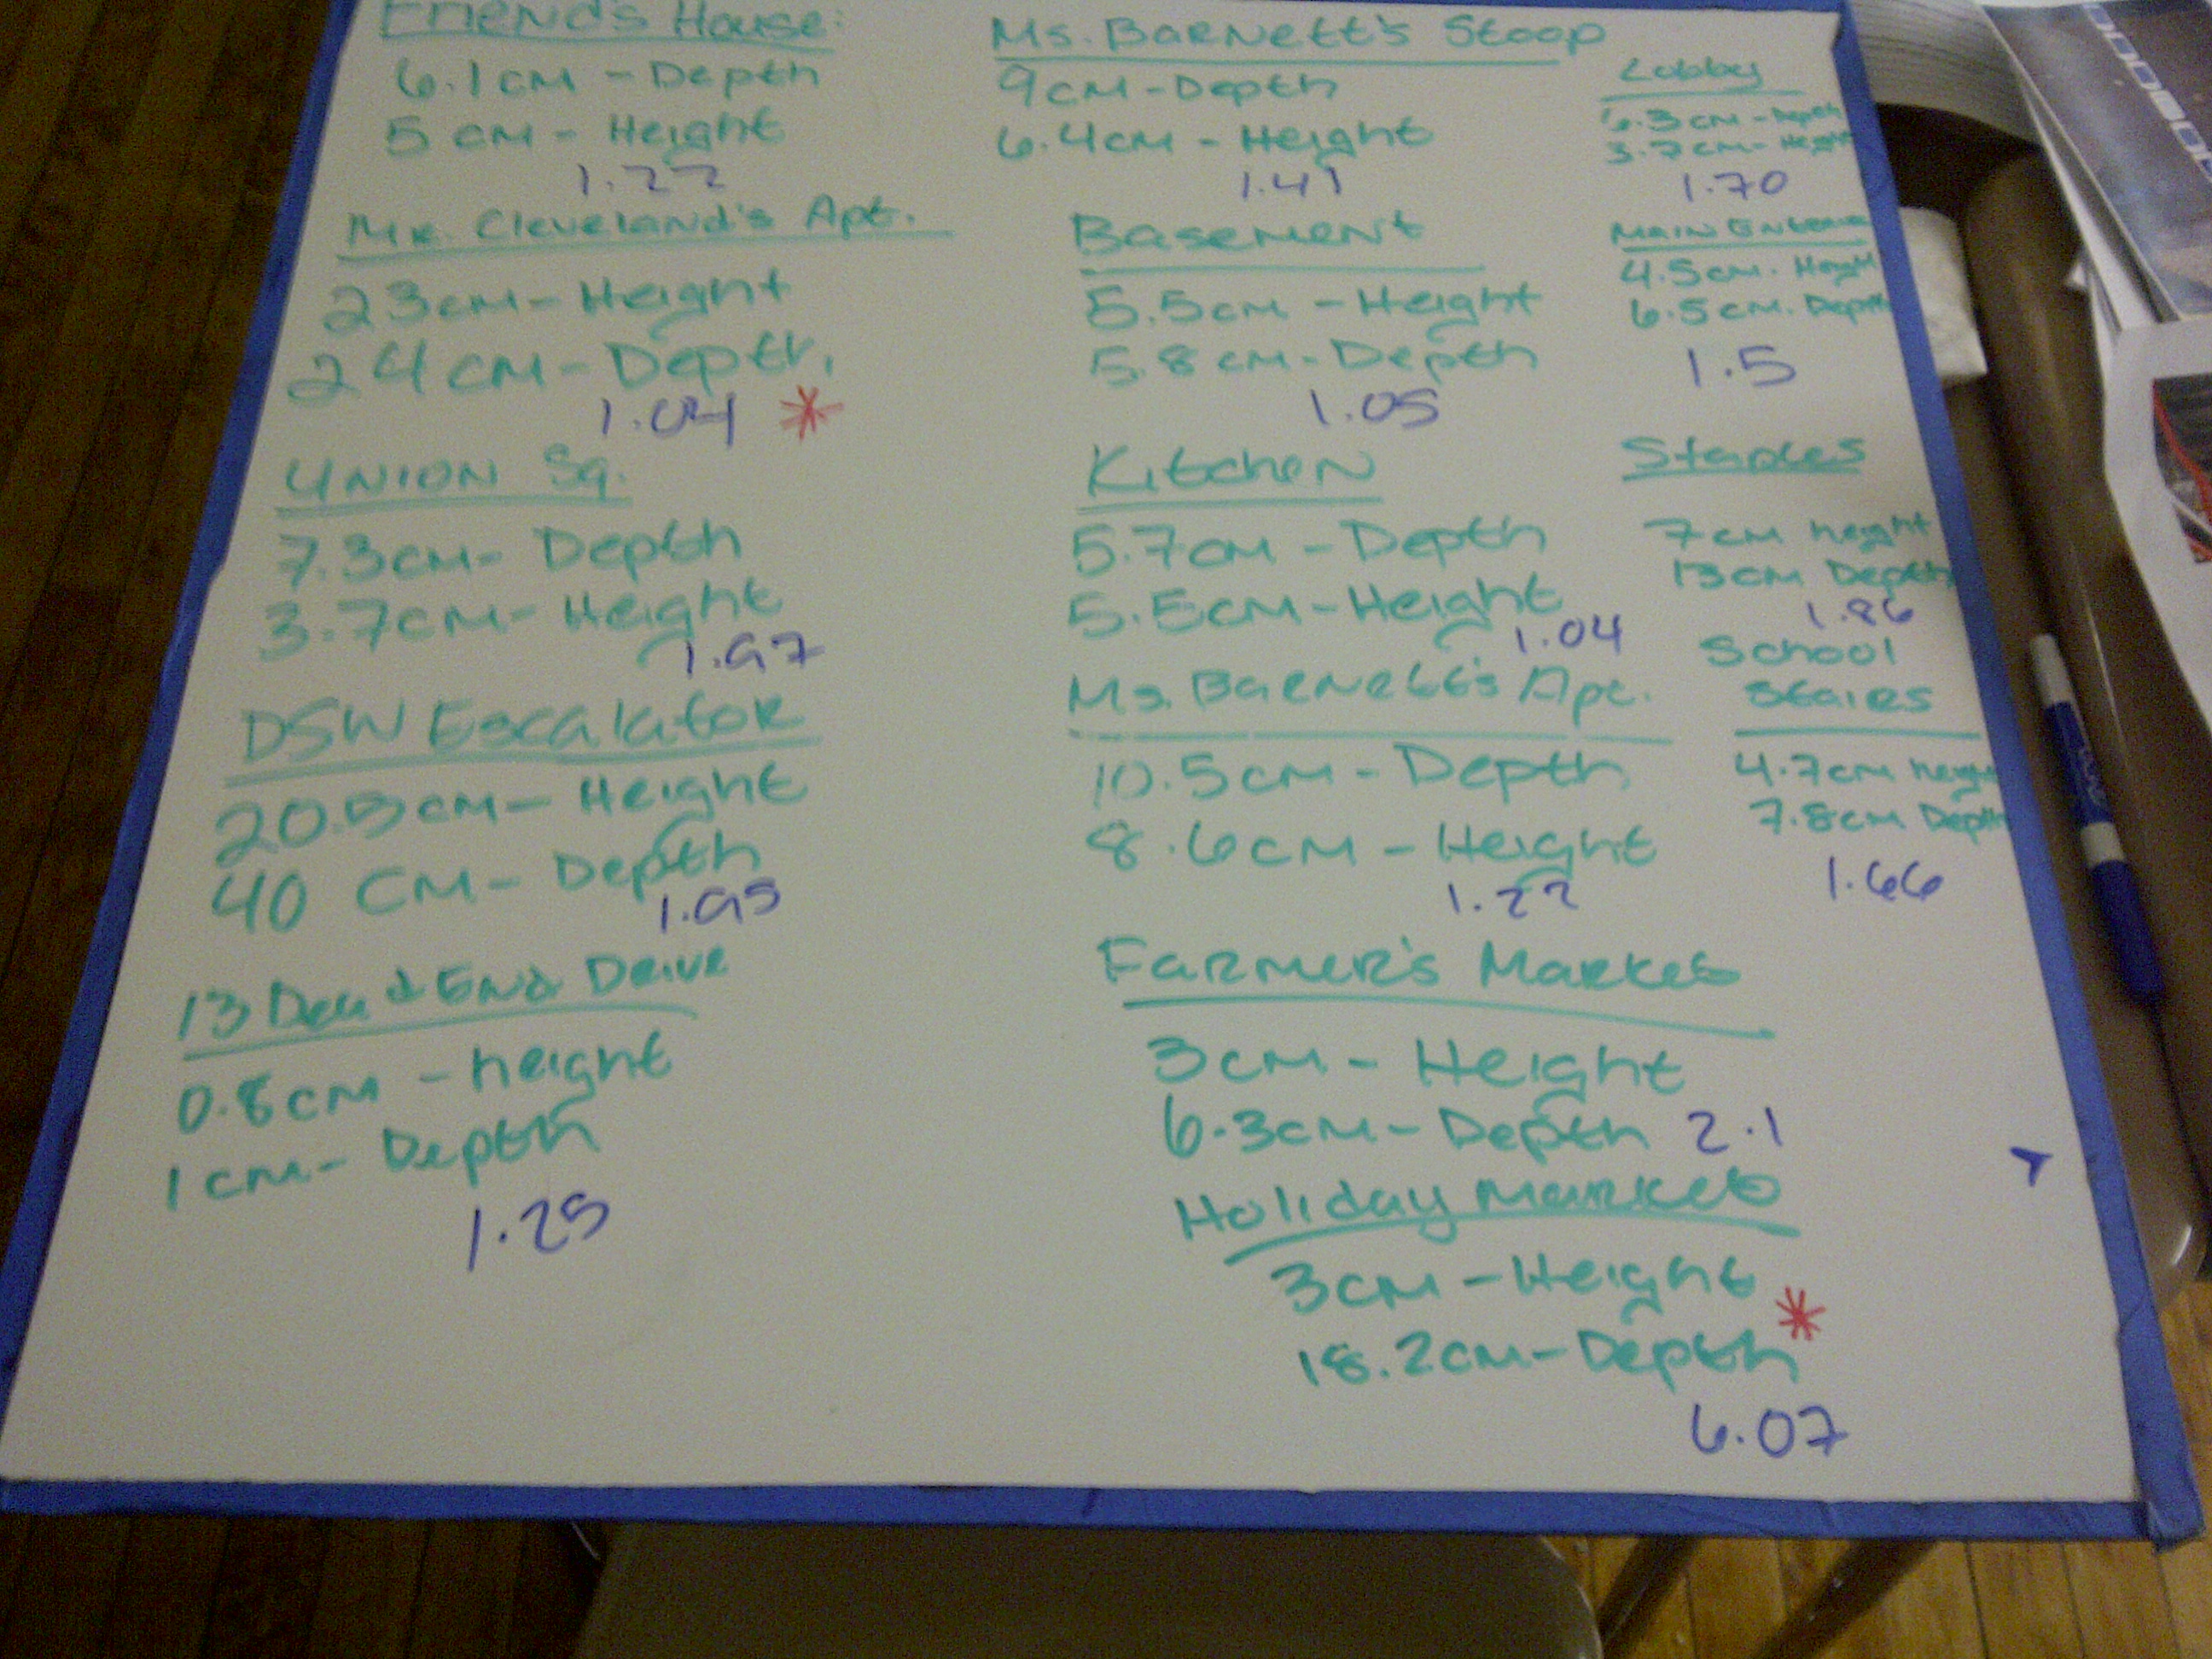
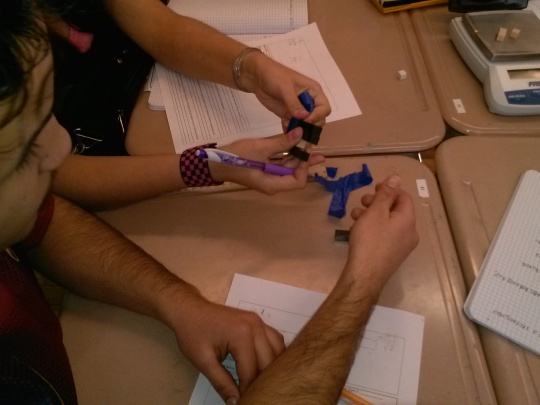
I noticed that, despite what I expected, the longer Cuisinaire rods are much less dense that the small single cubes. So I used some amount of cubes and some amount of rods to make the mystery blocks. Then I simply give the kids one cube, one rod, the block, a scale, and a ruler, and ask them to figure out how many if each kind are in the block.
This lab was much more procedural when I first made it, but I’ve embraced the problem-solving classroom since then. And while my students were unsure of what to do, I feel like we’ve built up to this kind of unstructured problem, and most of them took to it well.
When they thought they had a solution, I would press them on it. “Why do you think it’s 5 yellow blocks and 5 cubes?” If they responded that that matches up in size to the block, I would point out any others do also, like 4 yellow and 10 cubes. I would implore them to use the tools available to them. (We also talked about mass, volume, and density in the warm-up.) If they told me some combination gave them the right mass, I would point out that their volume would be off. If they told me no combination gave them the right volume AND right mass, I would ask why. Most would identify the tape/foil/wrapping paper as the culprit.
Most importantly, if they gave me a solution that was well supported, even if incorrect, I told them there was only one way to find out if they were right: unwrap the mystery block and see. The excitement at each table when they got to that point was palpable. One student said it felt like Christmas. If they were right, they were ecstatic. If they were not, they tried to figure out where they went wrong.
When I first made this lab, I put it at the end of the Systems unit, thinking they would need those tools. Now I have the confidence to put it at the beginning, and let them figure it out. No one used equations explicitly to solve the problem, but they definitely grappled with the idea that two separate constraints need to both be satisfied in order to solve a problem, which is an important understanding for systems.
This post is getting a little long, so I’ll probably split off into another posts with problems I had with the lesson, things that went well, and a call for suggestions. I just wanted to get this out there. It’s been a long time since I’ve blogged, because I’ve had a lot going on in my life. So I want to get back to it.
The Lab Sheet
The Archimedes Lab
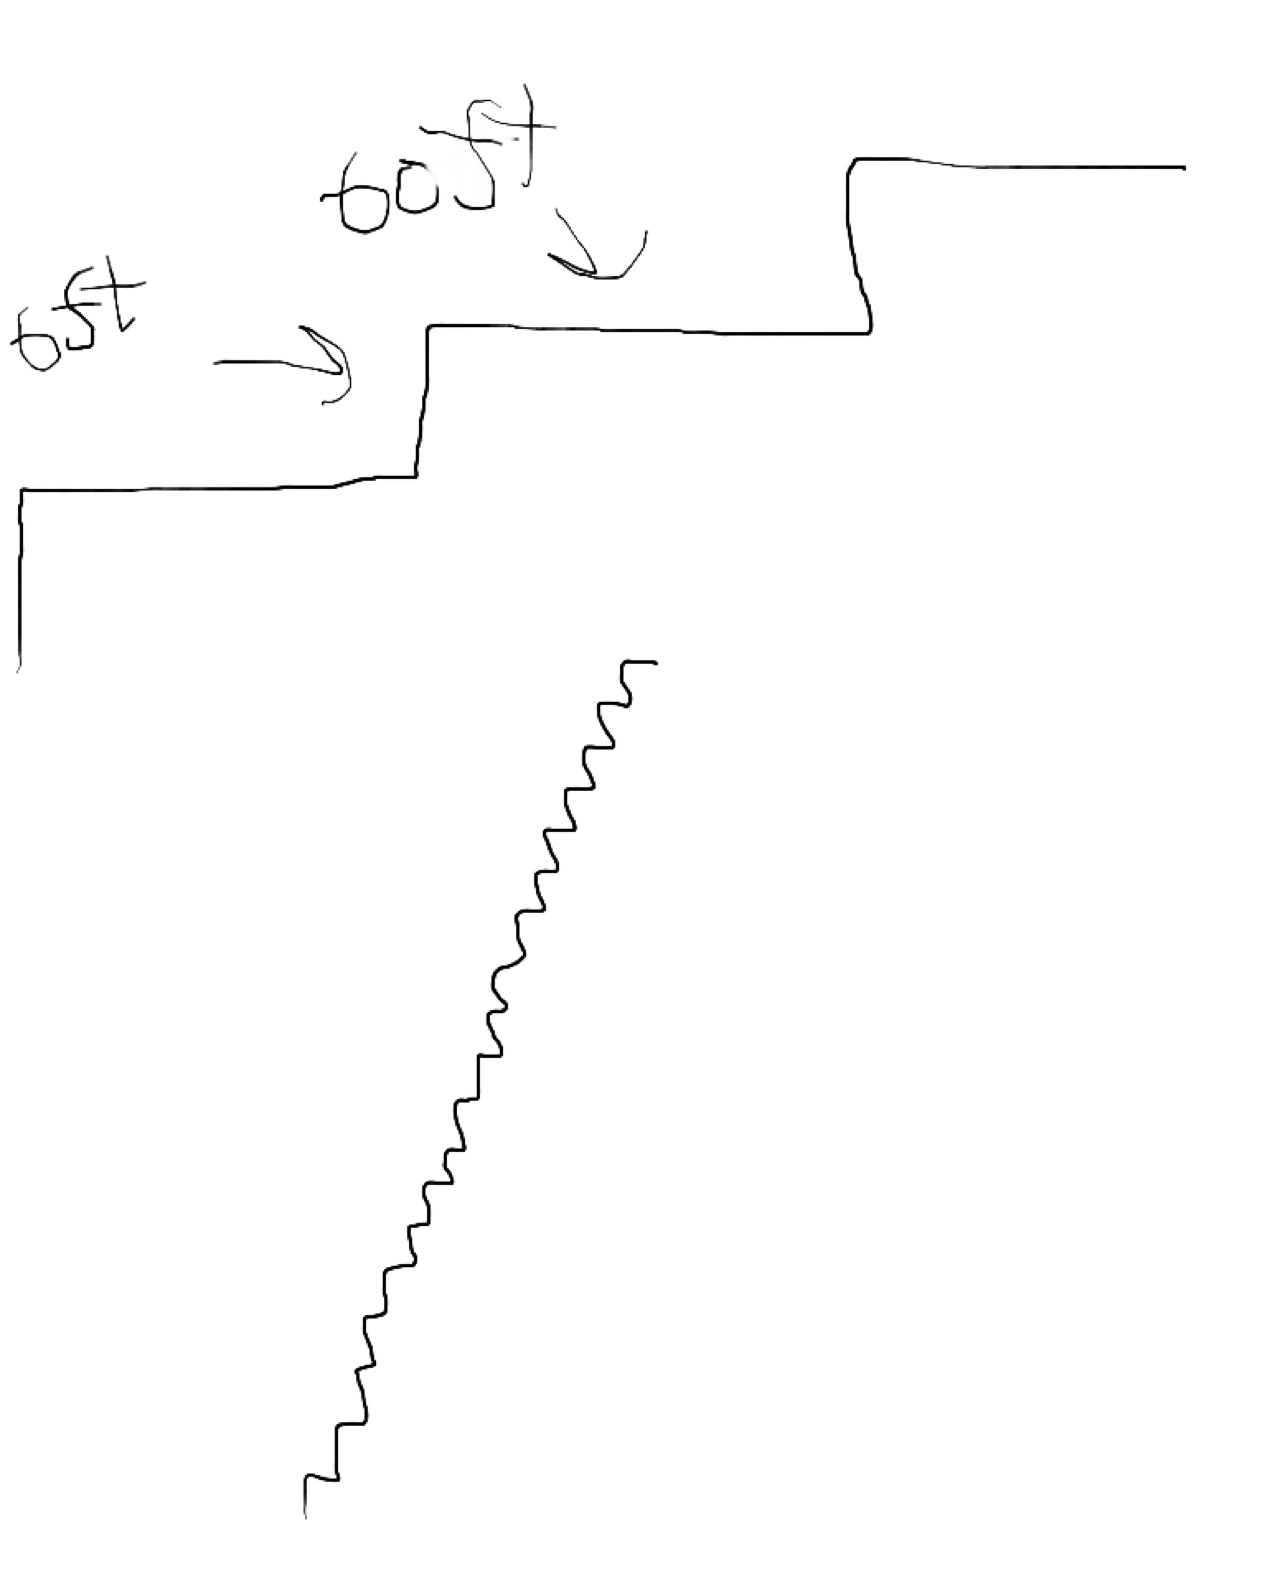
Accompanying Graph
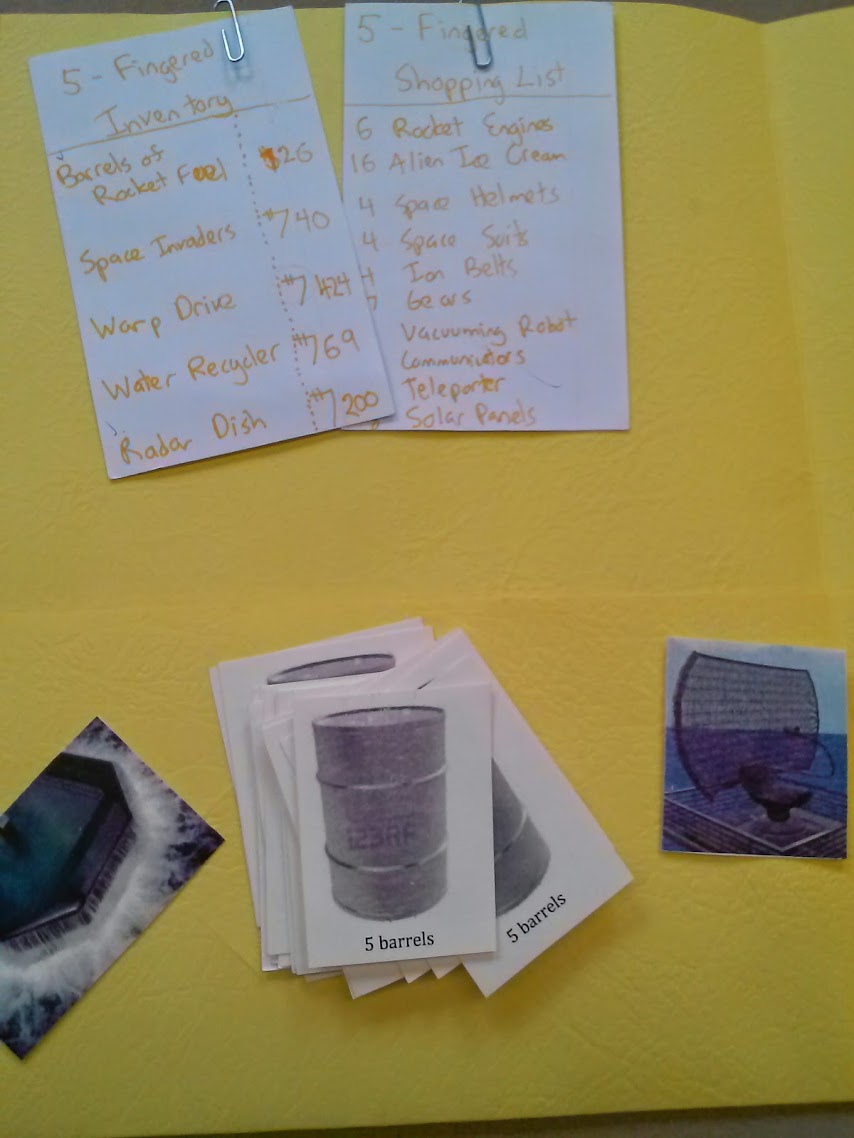
 . But that’s only for us humans. If that number were written by the 5-fingered aliens, it would be
  . And, in general, if we wanted to figure out what that number means for any number-fingered alien, we would use
  . So we looked at that in Desmos.

 So if they told me any angle, I could tell them the ratio, and then they could just set up the proportion and solve.