Discrete Math & Democracy, Week 1
This year I’m teaching a new class called Discrete Math and Democracy, which is a course I’ve wanted to teach for a long time, ever since I helped my ex prepare to teach a similar course at his university. I spent a lot of time learning things and gathering materials over the summer, including ones I got from previous workshops at Math for America. I thought about doing a Blog180 to document my time teaching the course, but that’s not the kind of blog this is, so I figure I’ll debrief somewhere more private and then do weekly updates here, along with any materials I use. (Hopefully I can still squeeze in some other posts on other topics in the meantime.)
The first day I started off asking the students to think of a process for choosing a snack. They suggested each person suggesting a snack and then we’d decide, so we got straight to the idea of nominating candidates. At first three people were going to make the same nomination (Oreos) so it seemed like that might be the winner, but then I had them make preference ballots for our four candidates. The voting profile for those are below.
It became clear that while Oreos were the plurality winner, Rice Krispies Treats were more of the consensus choice, so we right away had a tension between what they might have expected for a voting system and what might be “right,” so that couldn’t have worked out better. I then had them read this article on different kinds of distributive justice by Matt Bruenig to help get at the idea that there are different ways to structure society that all have merit, and a similar thing applies to electoral systems as well. We need to know what our goals are before we can decide on a best system.
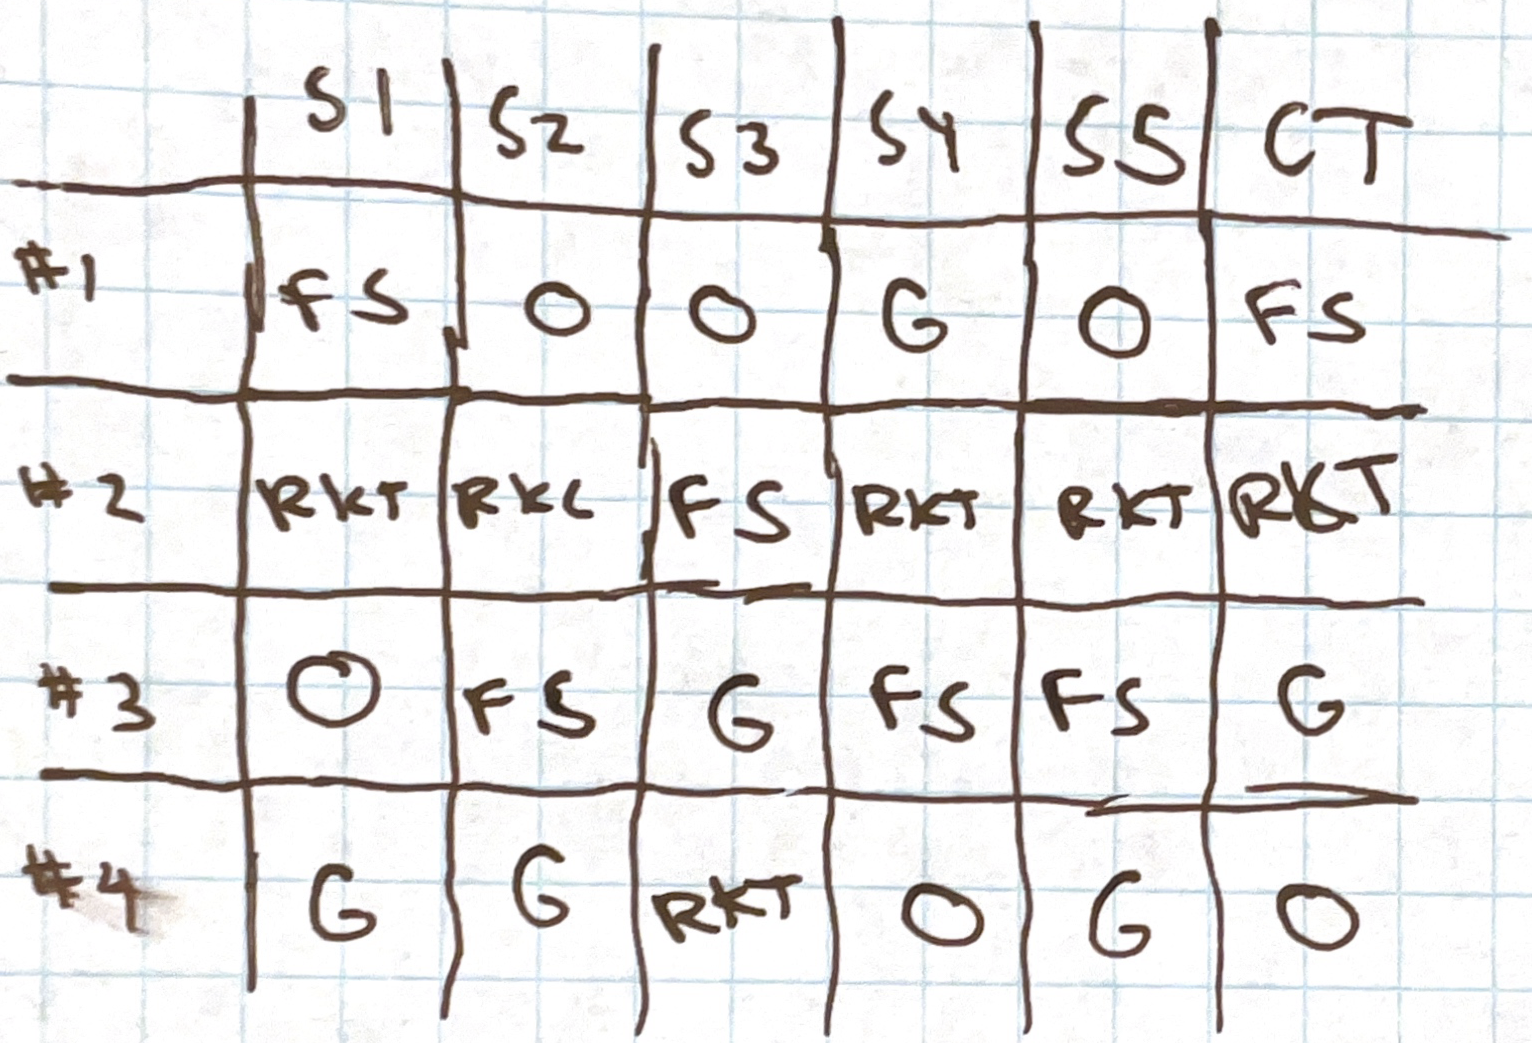
The next day, Rice Krispies Treats in hand, we looked at a tabulated voting profile and I gave them the challenge of coming up with a reasonable way to count the votes such that each candidate can be the winner. (This is adapted from a material I got from a workshop so long ago I don’t remember which, although it was probably led by Kate Belin.) I turned it into the worksheet below:
The students were able to come up with equivalents to plurality and Borda count on their own, as well as a system where they counted all #1 & #2 votes (which I guess could be equivalent to a kind of approval voting). They needed a little hint to get Edamame and Bagels to win. (Spoiler: it’s IRV and Top Two Runoff.)
After that I had them learn some basics of spreadsheets, as we’ll be doing a lot of work with them, using this wonderful tutorial by Jed Williams.
Next, I pared it back to two-candidate election systems and we looked at various kinds and what properties they have.
I was reminded of the important of having examples and, even better, non-examples. An important social choice theorem is May’s Theorem that states that the only two-candidate system that is anonymous (treats all voters equally), neutral (treats all candidates equally), monotone (you can’t lose by gaining more votes), and nearly decisive (always has a victor unless the candidates have the same number of votes) is a simple majority.
But simple majority is such a basic and obvious system that it’s hard to see why this theorem is a big deal, and often the only counterexamples given in textbooks are dictatorship and monarchy, which are obviously antidemocratic. But I found a new book (A Mathematical Look at Politics) that gives a few more examples of systems that are reasonably democratic but don’t have all of those properties, which helped clarify it.
They are supermajority (you need a higher threshold to win, like 2/3 of states to pass an amendment), status quo (if a challenger doesn’t get a certain number of votes, the status quo wins – this is how the filibuster works), and probabilistic (a winner is chosen at random, with more votes increasing odds).
Filling out the chart was a good exercise, though how to determine the properties of probabilistic systems was a little tricky.
Lastly, we worked on another sheet where we worked out the winner with several systems, and then proved May’s Theorem with a few fill-in-the-blanks.
The proof actually went quite well! It took me a while to wrap my head around it when I read it myself, but I think the blanks helped us consider the various properties and how it works. (This proof is for an even number of voters, so I had them do the other case, with odd, for homework.)
Off to a good start!


